Datenportal Landesplanung Baden-Württemberg – Understanding Regional Development


A “Landesentwicklungsplan”, or state development plan, is the highest level in the hierarchy of German land-use planning. Since spatial planning and regional development affect our lives in many ways, relevant information on trends and existing regulations needs to be accessible and understandable for every citizen.
The state development plan is the overarching legal framework for spatial planning within one of Germany’s sixteen states. It guides regional planning, municipal land use, and sector-specific planning. That means the plan determines which areas are suitable for matters such as housing, shopping, industry, farming, infrastructure, and nature preservation.
From time to time, these plans are updated and adapted to changes that have occurred in the real world. In the case of the German state of Baden-Württemberg, the latest state development plan dated back to 2002. Time for an update!
A cornerstone of the creation of a new development plan is to involve the wider public, from NGOs, to other professionals and citizens alike. In order to inform all these stakeholder groups and to enable them to provide feedback and requirements, the state’s Ministry of Regional Development and Housing tasked wetransform with the creation of a comprehensive interactive portal. This portal enables citizens to actively participate in the process component, as well as to understand the many variables that are relevant to finding the best compromises.
A key part for the latter is the “data portal”. It presents data on the state’s spatial development since the year 2000 and shows current and potential future trends that could impact the region.
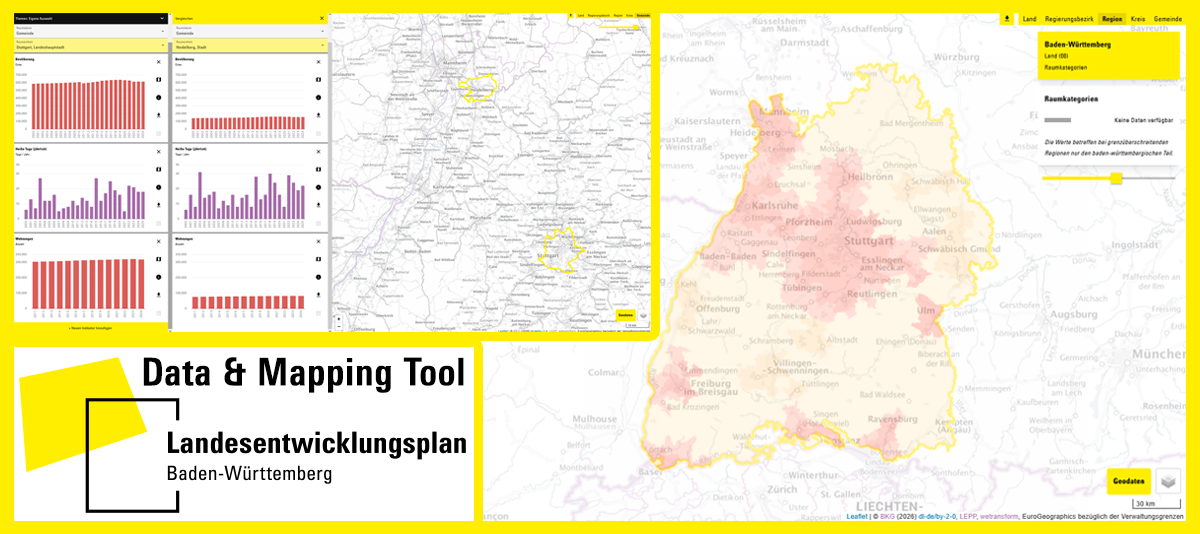
The Data & Mapping Portal
To support the process of defining the new development plan for Baden-Württemberg, wetransform has created a data and mapping tool for the exploration of spatiotemporal series.
This portal provides an overview of time series of spatial data within Baden-Württemberg and its sub-regions and displays these in a systematic, transparent, and user-oriented manner.
By using the portal, citizens and experts alike are able to analyse Baden-Württemberg's development over time. Categorised by several topics, they have access to interactive maps, consistent data, and comparative representations, with indicators ranging from average local temperatures to the number of cars.
Those indicators can be analysed in several ways:
- The map provides a quick overview by visualising regions
- The charts enable an efficiently view to trace the history of certain metrics
- The portal allows for the direct comparison between two regions that are of particular interest
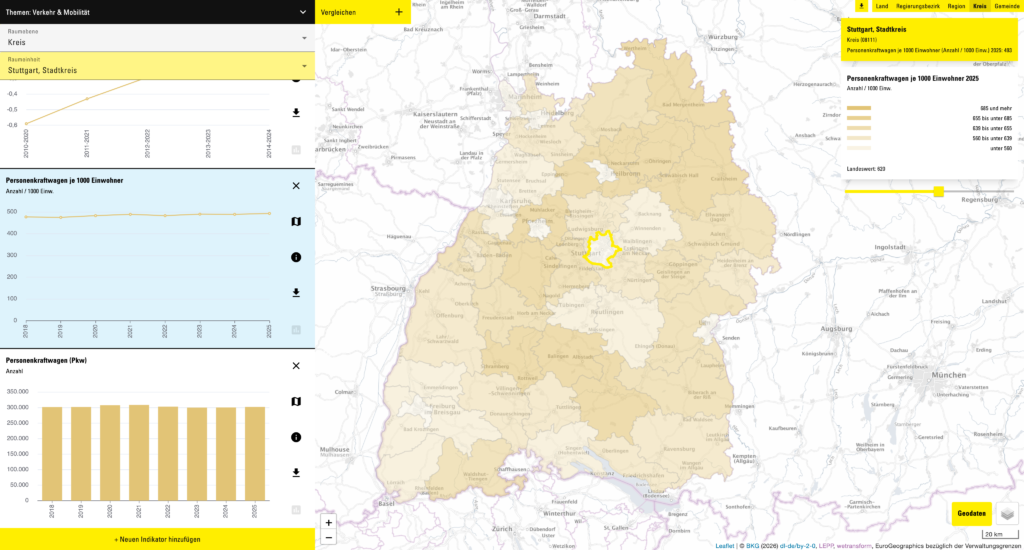
This screenshot shows that the amount of cars per 1000 inhabitants in Stuttgart did not change significantly over the last eight years. While Stuttgart is considered one of Germany's major car cities, the map visualisation suggests that the necessity of cars in rural counties of Baden-Württemberg is far greater than within the city limits.
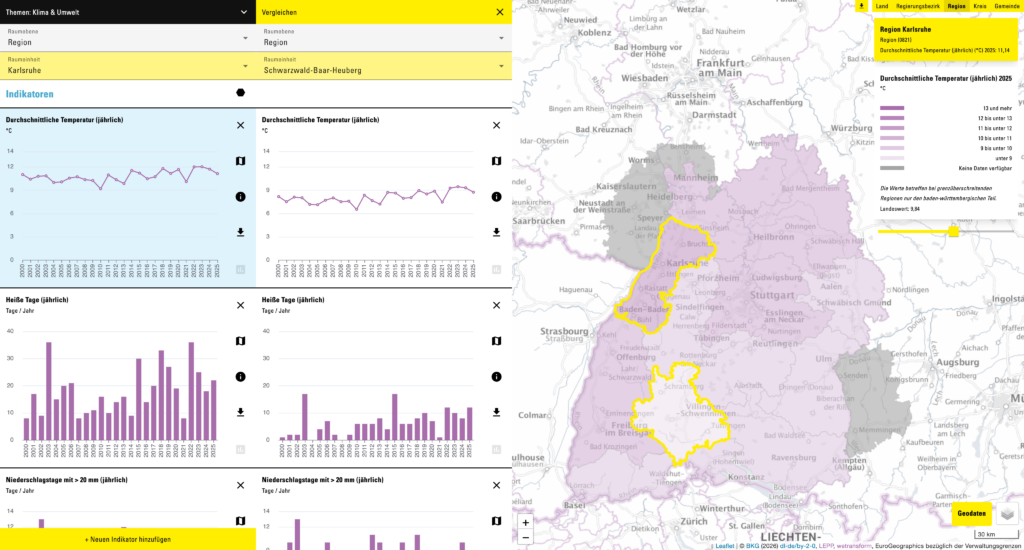
Here, you can see a comparison between Baden-Württemberg's hottest and coldest regions (incl. their history) in the charts, while the map simultaneously provides an overview of average temperatures across the entire state.
As Ansgar Schmitz-Veltin, the Head of Spatial Observation at the Ministry of Regional Development and Housing for Baden-Württemberg, puts it:
"With our data and mapping tool, we are ushering in a fresh era of spatial observation in Baden-Württemberg. This portal provides continuous insights into the structure of our spaces and how they are developing – serving regional and state planning, as well as all other stakeholders involved in spatial planning in our region, and making this information accessible to the general public."
Going Beyond Baden-Württemberg
Beyond Baden-Württemberg, this type of data portal could be valuable to all public authorities that need to communicate complex regional developments that take place over time. Given challenges such as climate adaptation, the green transition, the creation of resilient regions and communities, and many others, improved spatial planning will be essential in the coming years. However, such plans will only be better if all stakeholders involved can view and understand the facts.
If you want to learn how your data could be communicated using the wetransform Data Portal, reach out to us!