How much does it cost to transform INSPIRE data sets?
One thing we’re doing a lot for our customers is to create INSPIRE data sets from their original data. Usually these data sets are available in a specific national or organisation-specific schema and need to be restructured substantially to meet the INSPIRE requirements. This harmonisation process is one of the things that has given INSPIRE a bad reputation, as in that it is a complex and time-intensive endeavour.
Recently, we passed the 100-datasets-harmonised mark. As we usually track the effort needed for each of these projects, we now start to have a meaningful sample size to judge how much time the development of each of these transformation projects took – time to look at some numbers!
The data that we collect for every project includes the source schema, the target schema, the time spent and a few additional variables, such as schema complexity. In this post, we’re going to look at the mean time spent per target data model, we’ll look at the correlation between source model complexity and effort as well as simple counts.
The dataset
Out of all the projects we’ve done, 68 have time tracking records, and are related to INSPIRE – either they use one of the 34 core data specifications, or an extension of one of those.

As the graph shows, quite exactly half of the projects can be completed in 8 hours or less, while only very few projects took more than 64 hours to complete. 64 hours equal about 10 productive person days when we factor in some overhead.
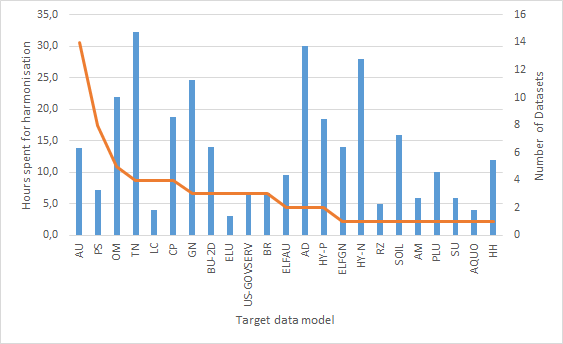
After looking at the general effort distribution, we wanted to dig a bit deeper – which INSPIRE Annex themes create a lot of effort for us?

The range the graph shows is pretty wide. While Addresses, Transport Networks and Hydrography Networks are all in the 30+ hour range, most of the other themes show mean times of 5 to 20 hours of required effort. As the orange line in the graph indicates, the number of datasets we’ve included for a given target data model is in many cases very small (1-3), so these numbers are certainly not stable.
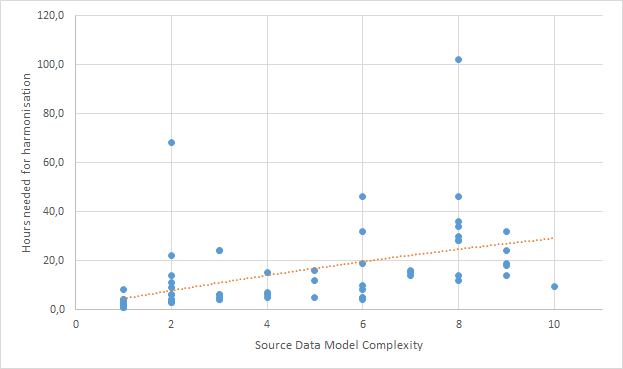
Maybe we need to look at the dataset from a different angle. As we often work on a fixed price basis, we want to make sure the estimates we give are reliable, so it is important for us to know what drives effort up. Thus, the next thing we look at is source data model complexity. We measure complexity using an arbitrary set of measures that tests existence of some model features (such as foreign key relationships and inheritance) as well as model size to give a number between 1 (e.g. a single shapefile) and 10 (massive model, with every modelling feature you can imagine).

This graph does show an interesting – and not really unexpected relationship. On the X-Axis, we can see the source model complexity, on the Y-Axis, we see the time spent for the projects. We indicate effort and complexity for each project with a blue dot, and the trendline with an orange dotted line. The relationship is pretty clear: The more complex the model, the higher the mean effort. The trendline is actually almost linear, and shows a growth from about 3 to 28 over the complexity range from 1 to 10 – which is a factor close to 10.
Our conclusions?
- Source model complexity is so far the best indicator for expected effort in a project;
- Effort varies a lot across different INSPIRE themes;
- Overall, more than half of the INSPIRE harmonisation projects can be completed in less than a day (caveat: we are quite experienced, so a person knowing less about INSPIRE and hale studio will need more time).
What are your experiences? How much time did you spend on transformation project setup?

